Class 7 Maths Maharashtra board Solutions Chapter 15, Practice Set 55
Maharashtra State Board Class 7 Maths Solutions Chapter 15 Statistics Practice Set 55
Hello students..
so in this problem set we are going to construct frequency distribution table in easiest way…
Sometimes, in collected data, some scores appear again and again. The number of times a particular score occurs in a data is called the frequency of that score.
In such cases a frequency table is made with three columns, one each for the score, the tally marks and the frequency.
- In the first column, scores are entered in ascending order. For example, enter 1, 2, 3, 4, 5, 6 in order one below the other.
- Read the scores in the data in serial order and enter a tally mark ‘।’ for each in the second column of the table in front of that score, e.g. if you read the score ‘3’, make a tally mark in front of 3 in the second column. Place four tally marks like this ।।।।, but make the fifth one like this ।।।।. It makes it easier to count the total number of tally marks.
- Count the total number of tally marks in front of each score and enter the number in the next, i.e. third, column. This number is the frequency of the score.
- Lastly, add all the frequencies. Their sum is denoted by the letter N. This sum is equal to the total number of scores.
- Finally your frequency distribution table is ready.
by using this these 4 steps you can easily construct the frequency distribution table.
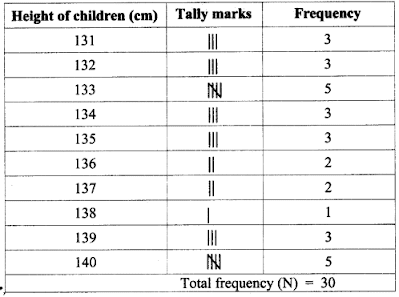
Question 1. The height of 30 children in a class is given in centimeters. Draw up a frequency table of this data.
131, 135, 140, 138, 132, 133, 135, 133, 134, 135, 132, 133, 140, 139, 132, 131, 134, 133, 140, 140, 139, 136, 137, 136, 139, 137, 133, 134, 131, 140
Solution:
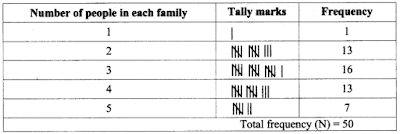
Question 2. In a certain colony, there are 50 families. The number of people in every family is given below. Draw up the frequency table.
5, 4, 5, 4, 5, 3, 3, 3, 4, 3, 4, 2, 3, 4, 2, 2, 2, 2, 4, 5, 1, 3, 2, 4, 5, 3, 3, 2, 4, 4, 2, 3, 4, 3, 4, 2, 3, 4, 5, 3, 2, 3, 2, 3, 4, 5, 3, 2, 3, 2
Solution:
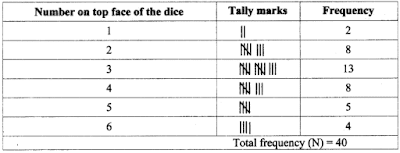
Question 3. A dice was cast 40 times and each score noted is given below. Draw up a frequency table for this data.
3, 2, 5, 6, 4, 2, 3, 1, 6, 6, 2, 3, 5, 3, 5, 3, 4, 2, 4, 5, 4, 2, 6, 3, 3, 2, 4, 3, 3, 4, 1, 4, 3, 3, 2, 2, 5, 3, 3, 4.
Solution:
Question 4. The number of chapatis that 30 children in a hostel need at every meal is given below. Make a frequency table for these scores.
3, 2, 2, 3, 4, 5, 4, 3, 4, 5, 2, 3, 4, 3, 2, 5, 4, 4, 4, 3, 3, 2, 2, 2, 3, 4, 3, 2, 3, 2.
Solution:
Question 1 : Make groups of 10 children in your class. Find the average height of the children in each group. (Textbook pg. no. 96)
Solution: (Students should attempt the above activities on their own.)
Question 2. With the help of your class teacher, note the daily attendance for a week and find the average attendance. (Textbook pg. no. 96)
Solution: (Students should attempt the above activities on their own.)
What we Learn in these Practice Set
- A simple way to tabulate scores is by using tally marks.
- A table in which the number of tally marks indicates the frequency is called a frequency table.
- When the number of scores is very large, a frequency table is used to find their average.


